Covid19

CDC COVID-19 Public Use Data
Let us revisit the CDC Covid-19 Case Surveillance Data.
Data Input
We start by loading the dataset. There are well over 3 million entries of individual, de-identified patient data, so this process takes a while.
# URL link to CDC to download data
url <- "https://data.cdc.gov/api/views/vbim-akqf/rows.csv?accessType=DOWNLOAD"


# Use `vroom` function is used to load the table as the file is large.
covid_data <- vroom(url)%>%
  clean_names()
library(scales)
Data Wrangling
We now select relevant columns and calculate death rates with this formula:
death_rate = Number of deaths/Total Deaths x 100
# Create a death_rate_comorbidities column
covid_death_rate_comorbidities<-covid_data %>%
  filter(sex %in% c('Male','Female'),!age_group %in% c('Unknown',NA),medcond_yn %in% c('Yes','No'),death_yn %in% c('Yes','No')) %>% #filter for relevant values
  select(sex,age_group,death_yn,medcond_yn) %>%
  group_by(sex,age_group,medcond_yn) %>%
  summarize(death=sum(death_yn=="Yes"),total=n()) %>%
  mutate(death_rate=(death/total*100)) %>%
  select(sex,age_group,medcond_yn,death_rate)

# Change labels for better clarity
new_labels<-c('Yes'='With Comorbidities','No'='Without Comorbidities')
Does Covid 19 death rate increase with co-morbidities?
Next, we plot a graph of Covid death % percent by age group, sex, and presence of co-morbidities.
ggplot(covid_death_rate_comorbidities,aes(x=death_rate,y=age_group))+
geom_col(fill='blue')+
facet_grid(medcond_yn~sex,as.table=FALSE,labeller=labeller(medcond_yn=new_labels))+
  theme_bw()+
  geom_text(aes(label=round(death_rate,digits=1)),hjust=-0.1,size=3)+
  expand_limits(x=c(0,72))+
  scale_x_continuous(labels=label_percent(scale=1))+
  labs(title = "Does presence of co affect Covid death rates?", subtitle='Covid death % percent by age group, sex, and presence of co-morbidities',x='',y='',caption='Source:CDC')+
  theme(plot.title=element_text(size=9))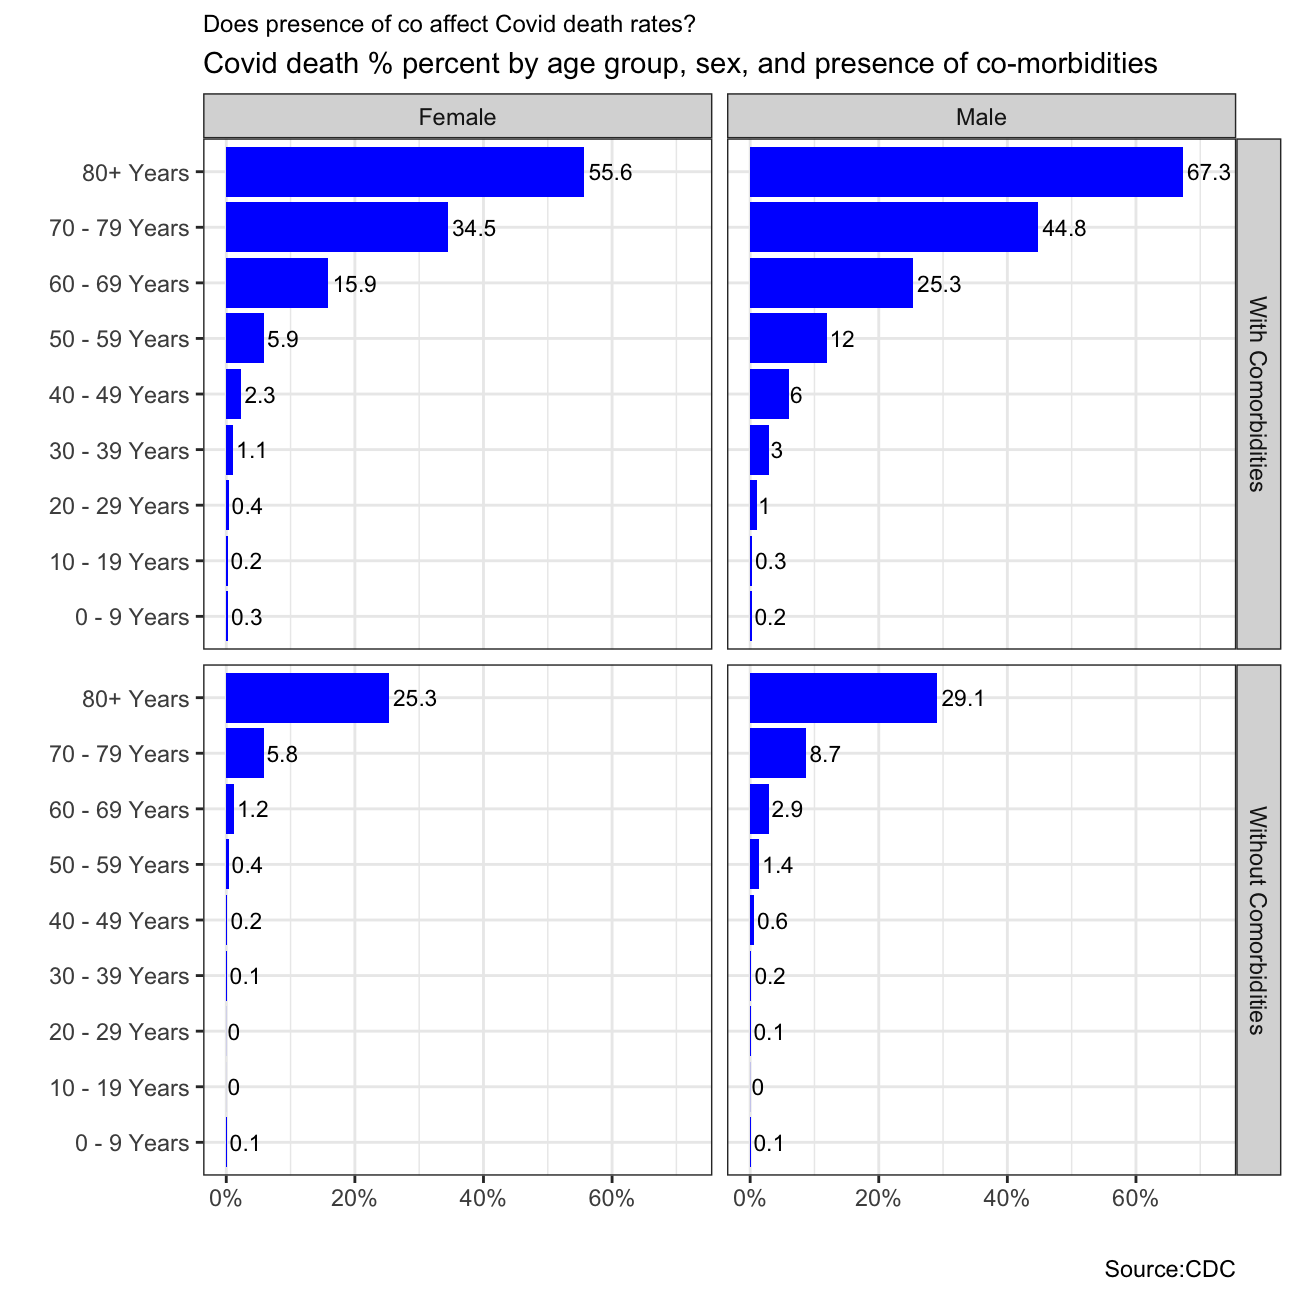
From this graph, we can see that:
Older groups have a higher death rates. E.g. 67.3% for males above 80 years old with co-morbidities.
Death rate for males are higher than females. (In 50-59 year group without co-morbidities, 0.4% females died vs 1.4% male)
For a particular gender and age group, Covid-19 patients who are admitted into ICU die at a higher rate compared to those not admitted.
This shows that increased age and presence of co-morbidities is correlated with higher death rate.
Does Covid 19 death rate increase with ICU admission?
Next, we plot a graph of Covid death percent by age group, sex, and ICU admission.
# Create a death_rate_icu column
covid_death_rate_icu<-covid_data %>%
filter(sex %in% c('Male','Female'),!age_group %in% c('Unknown',NA),icu_yn %in% c('Yes','No'),death_yn %in% c('Yes','No')) %>%
select(sex,age_group,death_yn,icu_yn) %>%
group_by(sex,age_group,icu_yn) %>%
summarize(death=sum(death_yn=="Yes"),total=n()) %>%
mutate(death_rate=(death/total*100)) %>%
select(sex,age_group,icu_yn,death_rate)
# Adjust labels
new_labels_icu<-c('Yes'='Admitted to ICU','No'='No ICU')
# Plot death rate vs ICU admission faceted by sex and ICU admissions
ggplot(covid_death_rate_icu,aes(x=death_rate,y=age_group))+
geom_col(fill='#ffa084')+
facet_grid(icu_yn~sex,as.table=FALSE,labeller=labeller(icu_yn=new_labels_icu))+
theme_bw()+
geom_text(aes(label=round(death_rate,digits=1)),hjust=-0.1,size=3)+
expand_limits(x=c(0,85))+
scale_x_continuous(labels=label_percent(scale=1))+
labs(title = "Does admission to ICU affect Covid death rates?", subtitle='Covid death % percent by age group, sex, and weather patient was admitted to ICU',x='',y='',caption='Source:CDC')+
theme(plot.title=element_text(size=9)) 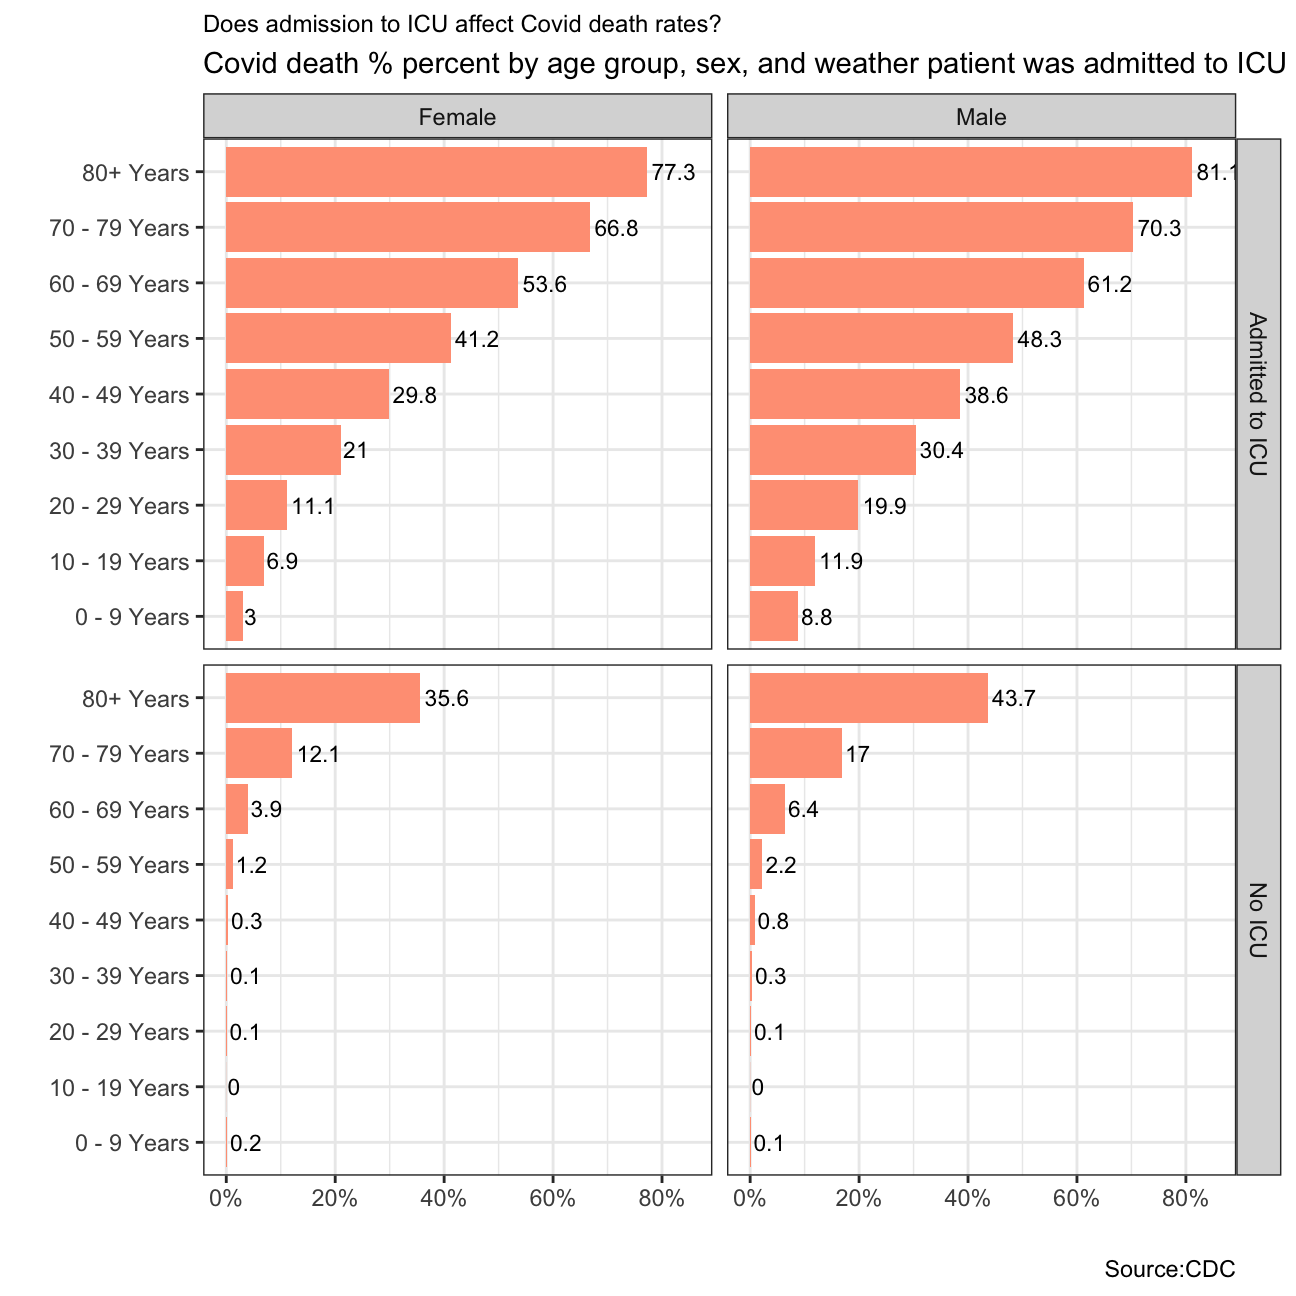 Here are some observations from this plot:
Older groups have a higher death rates. E.g. 81.1% death rate for males above 80 years old admitted to ICU.
Death rate for males are higher than females.
For a particular gender and age group, Covid-19 patients who are admitted into ICU die at a higher rate compared to those not admitted.
What can we infer?
It is important that correlation does not equate causation. In the context of this question, this is to say that old age and ICU admission does not cause an increase death amongst Covid patients, they are just correlated with a higher death rate.